The value-rich Infographic
Case Study
How to make value rich infographics:
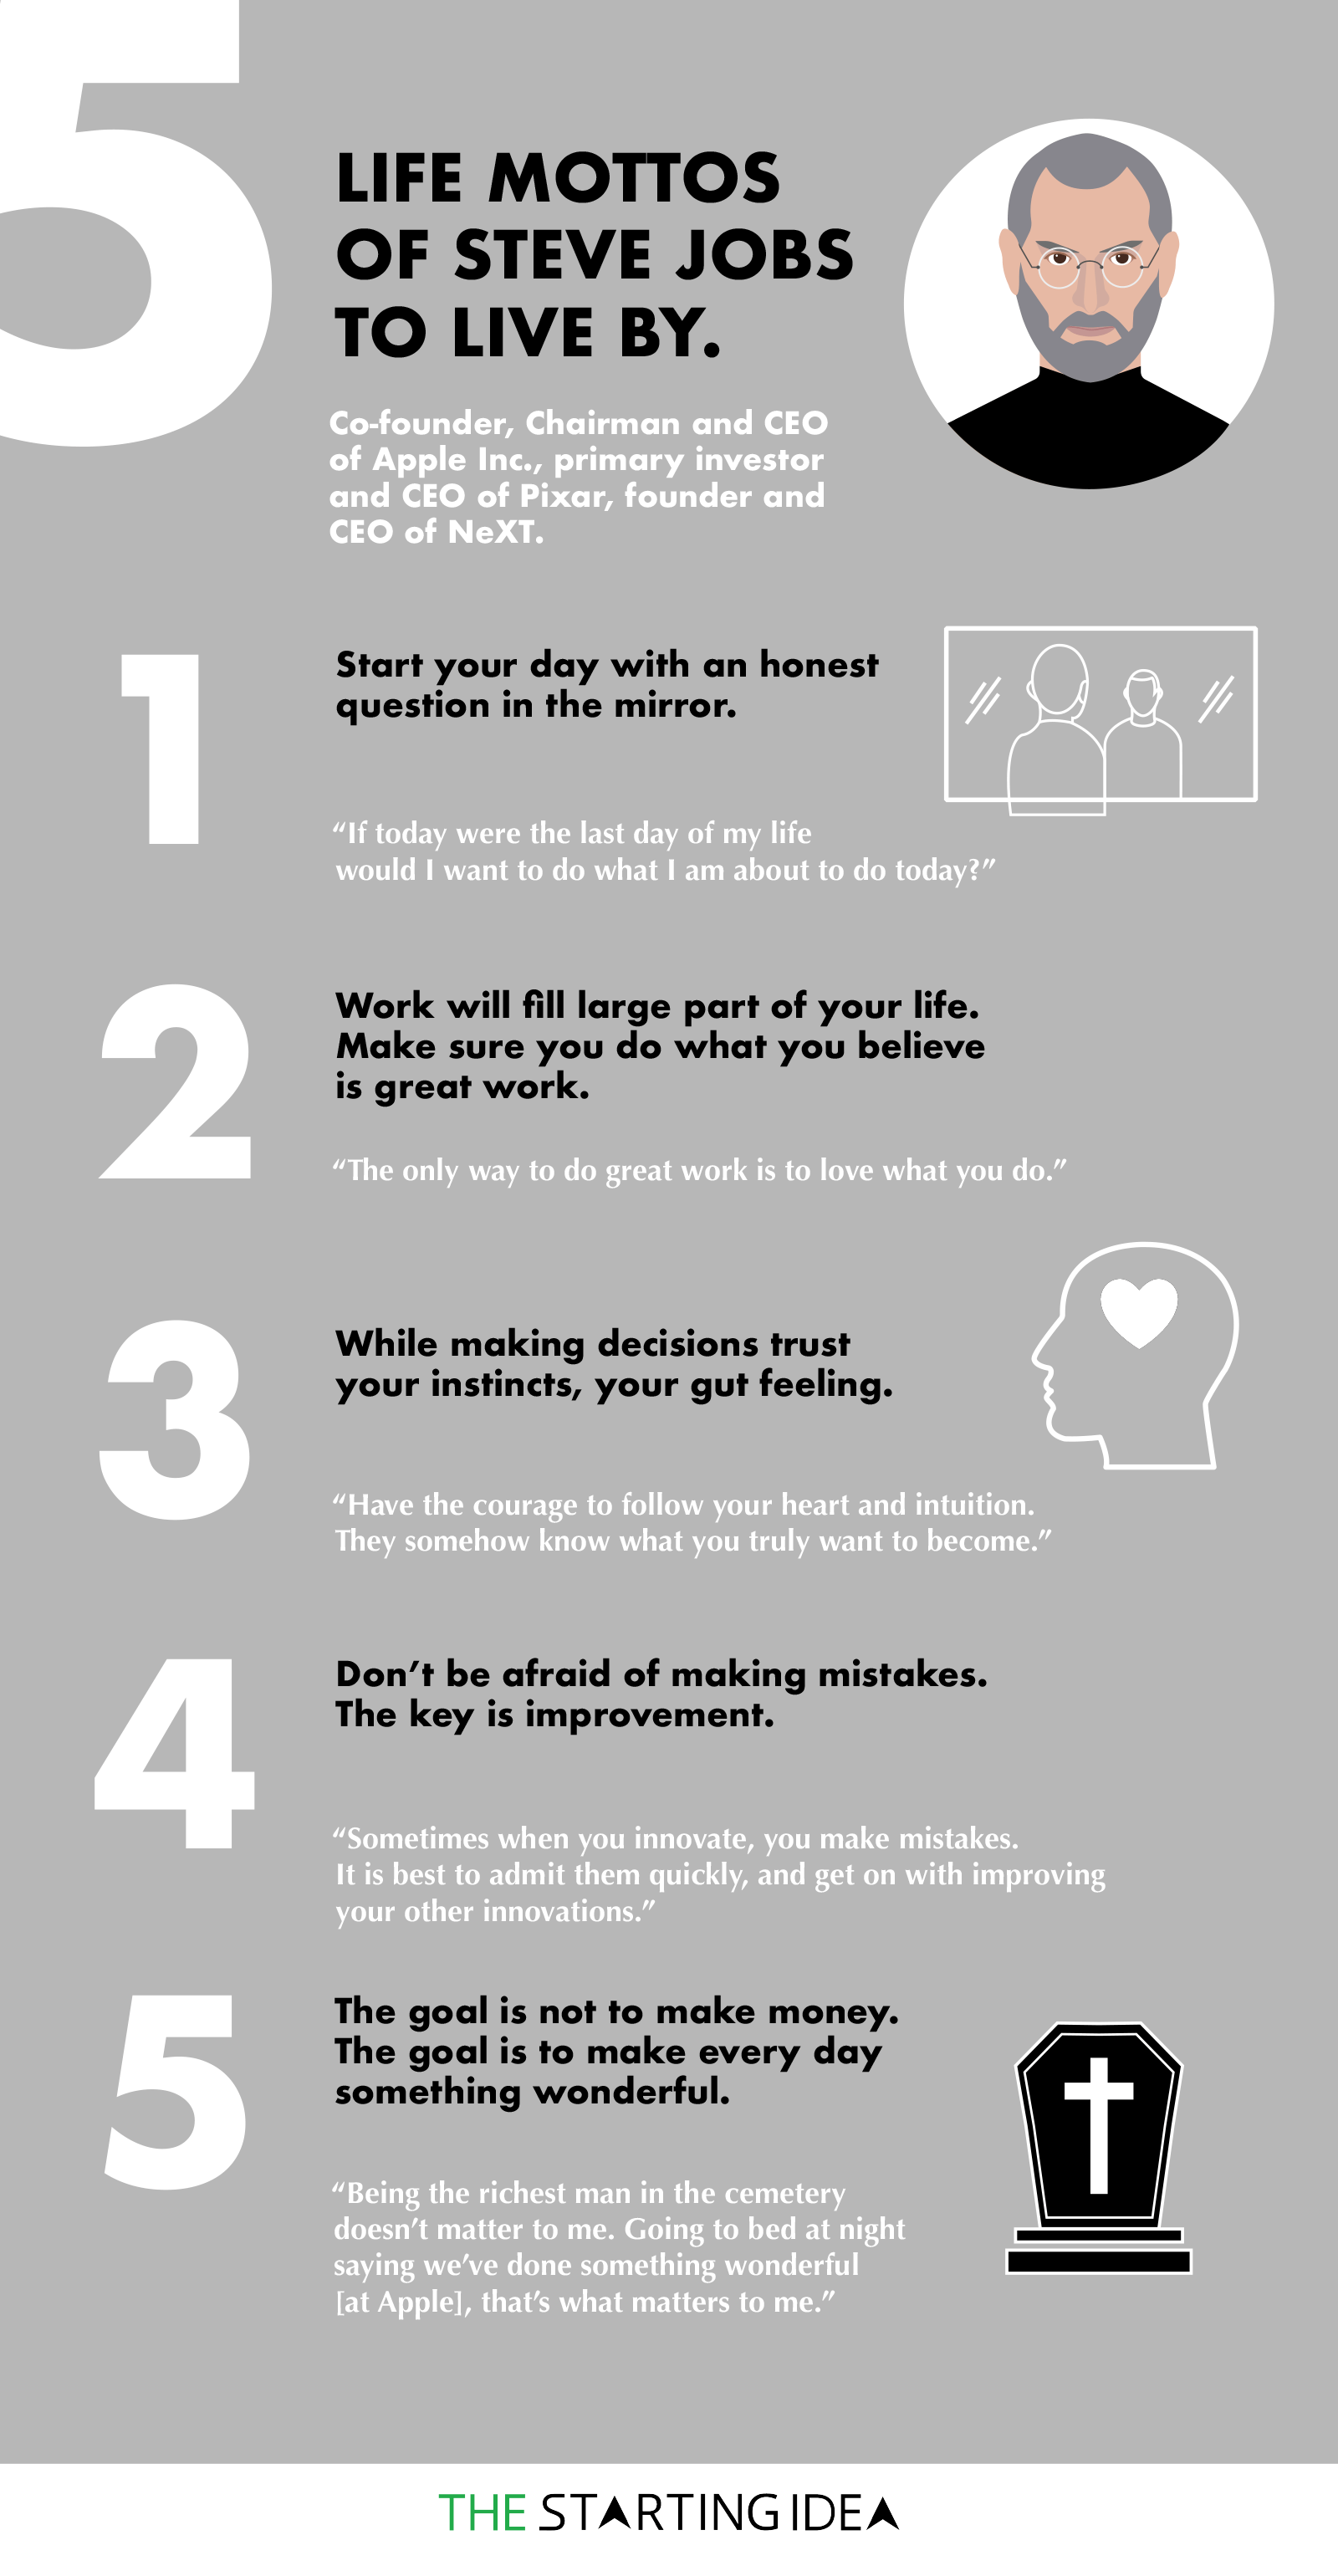
A Brand Bridge Solutions Infographics Case Study.


Creative Process
1. Research on the topic thoroughly.
PRO TIP: Find a series of listicles which give awesome value to your audiences. It can be Mindset Hacks, Famous Personality Quotes, Mindset Tips, etc.
2. Use Adobe Illustrator to create the necessary design assets.
It can be the image of the famous personality, hand-drawn icons demonstrating the marketing tip in action and so on.
Colour scheme should be consistent for every asset related to the topic.
5. Choose the right typeface.
Remember to not to use more than 3 different typefaces.
6. Arrange the layout and composition of the infographic.
A lot of infographics are cluttered with too much going on in them. As a marketer, you have less than 5 seconds to grab the attention of your audience, and if your design is chaotic with too much haphazardness, you will fail terribly. A way to avoid it is by using the 10 feet rule. Go 10 feet away from your system screen and see the layout, does it depict an easy to understand sequence to you? If not, remove unnecessary pieces one at a time to make the infographic simple and clear.
7. Create a grid and arrange every part of the infographic on the canvas.
8. Save the image.
Use the grid as a tool to filter your design for clarity purposes.
Bonus tip – Use WP Embed Code Generator for creating embed code for your infographic.
This can be used later for link building purposes.
Ready to talk?